Table of Contents
Introduction Quick Recap: Data Science Project 1: Sentiment Analysis Project 2: Weather Prediction Project 3: Dice Game Probability Project 4: Sports Team Analysis Project 5: Customer Segmentation Conclusion
Introduction
We live in a data-driven world. Data is all around us, and it is time that we understand the data, analyze it, and use it.
Data science can seem a daunting subject for kids to learn; however, numerous online platforms can help you teach data science to kids in a fun and engaging manner. We at Codingal have the right tools to help you get started. Read this quick guide on data science to help you get started!
Now, let’s discover the five awesome data science projects where numbers and information come to life! Let’s begin!
Quick Recap: Data Science
Some of you may be familiar with the world of data science, but if you are new here, don’t worry. Let’s briefly touch upon the basics of data science.
Data Science is a subfield of computer science and statistics, a progression of three steps. First, you collect data, then analyze the trends within the data, and lastly, make decisions based on the data.
In addition, data science plays an important role in many STEM fields, including biology, finance, and environmental science. By learning about data science, you can better understand these fields and see how data analysis is used to solve complex problems and make informed decisions.
It’s time to dive into some fun projects. Let’s go!
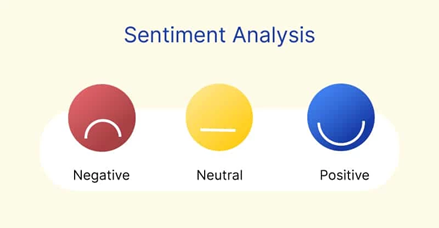
Project 1: Sentiment Analysis
Sentiment analysis is a technique used in real-world data analysis to understand people’s sentiments, preferences, and trends.
In this project, you can play the role of data scientist by showing random images from the internet to your family and friends and recording their reactions. This simple game holds the key to uncovering fascinating insights and making predictions. Here’s how it works:
1. Collecting Data
You can collect a collection of images, perhaps using a tablet or computer, covering a wide range of subjects – from cute animals to delicious foods, beautiful landscapes, and more.
2. Show and Record
One by one, show these images to your family and friends. You can record the participant’s reaction with a simple scale like ‘like,’ ‘dislike,’ or ‘neutral.’
3. Data Entry
The recorded responses are then organized in a spreadsheet or a chart. For instance, if everyone likes a picture of a cake, it suggests that cakes are liked by most of the participants.
4. Sentiment Analysis
Here’s where data science comes into play. You can use simple charts or graphs to visualize the reactions. For example, if most of the images of desserts receive positive reactions, the data indicates a preference for sweets.
5. Predictions
Building on this, you can make predictions. If the data shows a strong positive sentiment for cakes, it’s reasonable to assume that cupcakes might also be a hit.
Try this project with your family and friends, and then decide whether the cake is a fan favorite or not!
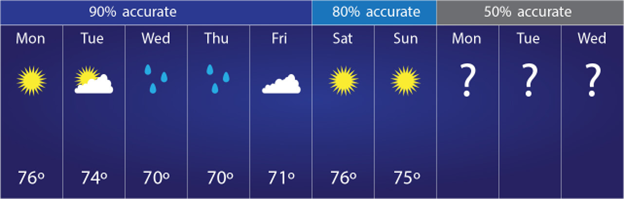
Project 2: Weather Prediction
Have you ever searched for the weather updates in your area or checked the news for the weather forecast? What if I tell you that you can do this with a little data analysis? We all know that weather is unpredictable, yet how can we predict weather? Data Science is the answer.
Now it’s your time to assume the role of budding weather forecaster; you will not only enjoy the process but also learn valuable data science skills along the way.
1. Gather Weather Data
You can begin by collecting daily weather data from your local area. This data includes information like temperature, precipitation, wind speed, and cloud cover. You can use weather apps or websites to find this information.
2. Weather Observations
Each day, you observe the weather around you. Is it sunny, cloudy, rainy, or snowy? What’s the temperature like? Are there strong winds or gentle breezes?
3. Data Entry
You can record these observations in a notebook or a weather journal. This could involve drawing weather symbols, noting temperatures, and writing down any unusual weather events.
4. Graphs and Charts
Now, it’s time to visualize the data. You can display temperature trends, precipitation patterns, and more using simple graphs or charts. This step brings the data to life.
5. Predicting the Weather
Building on this data analysis, you can start making your weather predictions. From your observation, can you predict the weather for a week? You can always confirm your prediction with the meteorology department’s predictions!
Project 3: Dice Game Probability
You must have played or still play Ludo or any dice game. What if I tell you that you can apply data science to a simple dice game as well?

Through the roll of the dice, you will discover the fascinating realm of chance and statistics while having a blast. So grab your friends and family and start a game of dice!
1. Dice Collection
Start by gathering a set of dice. You can use regular six-sided dice or experiment with different types, like twelve-sided or twenty-sided dice, for added variety.
2. Roll and Record
You must take turns rolling the dice and recording the outcomes. Each roll represents a random event, and the numbers on the dice become their data points.
3. Data Entry
Record the results in a notebook or computer. For example, if you roll a six-sided die and get a 3, 5, 2, 6, and 4 in five consecutive rolls, these numbers are entered into the dataset.
4. Visualizing Data
Use simple charts or graphs to visualize the outcomes. A bar chart showing the frequency of each number rolled is a great way to represent the data.
5. Predictions and Experimentation
Based on your data, you can predict future rolls. Will the next roll have a higher chance of landing on a certain number?
All the dice roll data you have collected will help you predict uncertain events. Maybe you can win the next game if you apply your data science skills to the dice game!
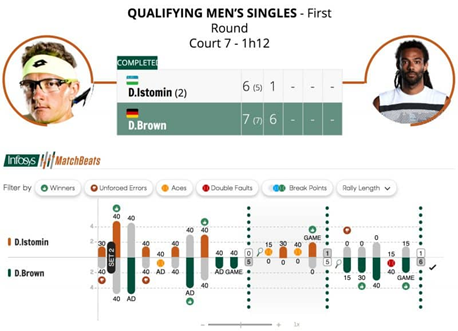
Project 4: Sports Team Analysis
Who doesn’t love sports and rooting for their favorite team? What if I tell you that you can analyze the performance of your favorite team and their winning probability with just a little data science magic?
So, for this project, you can explore and analyze data related to your favorite sports team. By combining your passion for sports with data science, you’ll uncover fascinating insights. Here’s how you can embark on this project:
1. Team Selection
First, choose your favorite sports team. Whether it’s soccer, basketball, baseball, or any other team, pick the one you’re most passionate about.
2. Data Collection
Gather data about your chosen team’s performance over a season. You can collect statistics like the number of wins, losses, goals scored, points earned, and player performance data. Sports websites or apps are great sources for this information.
3. Record and Organize
Create a spreadsheet or use a notebook to record the data. Organize each game’s outcome, player statistics, and relevant details.
4. Data Visualization
Next, create visual representations of the data. You can make bar graphs to display wins and losses, line charts to show points earned over the season, or pie charts to illustrate player contributions. Visualization makes it easier to understand and analyze the data.
5. Predictive Analysis
Based on your data analysis, make predictions about your team’s future performance. Will they make it to the playoffs? How might player performance impact upcoming games?
Now you know how the sports commentators are so precise with their stats and numbers on each player and team!
Project 5: Customer Segmentation
Have you ever visited a toy store and found a salesperson who helped you find the toy you might have wanted? How did the salesperson know what you want and what you will like? Well, that is where customer segmentation comes in.
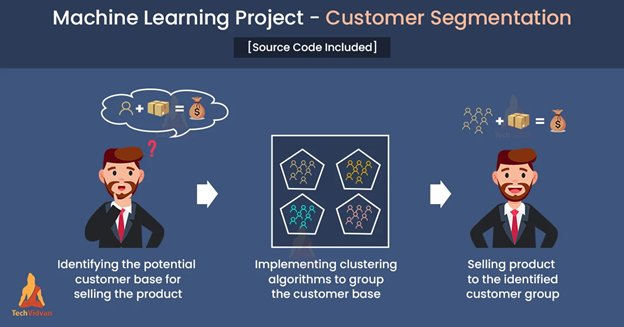
With observation and data analysis, they develop all the cool toys that a target audience may like and then sell them to the kids. In this project, you will do the same.
1. Data Collection
Go to the nearest shop or selling point with a guardian or parent. Ask permission from the vendors to observe all the sales they made. Start by collecting data about a particular item, like chocolate bars. Now, your focus is to find out which demographic is most likely to buy chocolates and which flavor.
2. Surveys and Data Entry
Share the survey with friends, family, vendors, and customers and collect their responses. Enter the survey data into a spreadsheet, recording each person’s answers.
3. Customer Grouping
Now, it’s time to group your customers. Think of categories like “White Chocolate,” “Milk Chocolate,” or “Almond Chocolate.” Based on survey answers, sort your customers into these groups. For example, two different females bought almond chocolate bars.
4. Visualization
Visualize your customer groups using colorful pie charts or bar graphs. Each group should have its section in the chart, showing how many people fall into each category.
5. Analyze and Predict
Explore your data to understand the most popular group and why. Predict what flavors might be best to offer based on your findings and who to sell them to.
So, are you ready to embark on your customer segmentation adventure?
Conclusion
Kudos to you for coming this far. You must have had a lot of fun and learned new skills while doing all these data science projects. Let your imagination soar high, and come up with your own small data science projects!
If you are new to the world of data then the best way to introduce you to data science is by signing up for a guided and personalized online data science course for kids.
Our data science teachers are all qualified data scientists trained to match the style and pace of learning to suit your child. Codingal courses are designed to make kids fall in love with coding. Book a free class and see for yourself.